0160 Subqueries in MonetDB
First, we will create sample tables.
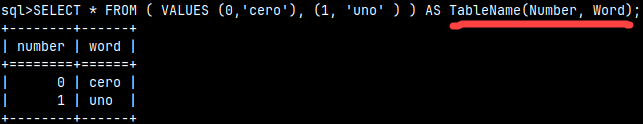
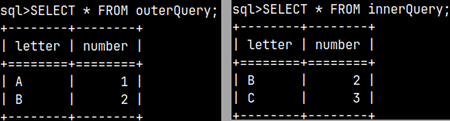
1) CREATE TABLE outerQuery ( Letter CHAR, Number TINYINT ); |
1) CREATE TABLE innerQuery ( Letter VARCHAR(1), Number SMALLINT ); |
The Definition of Subquery
Subquery is SELECT statement nested within some other SQL statement. Subquery can be nested within an UPDATE, DELETE, or other SELECT statement.
We can use subquery in three ways.
1) As a source table. Here we use a subquery in the FROM clause.
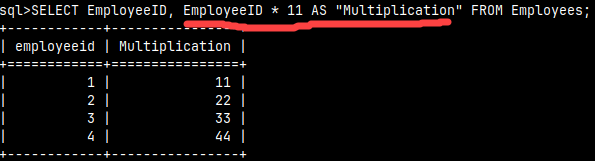
2) As an expression that will become a new column. Here we use a subquery in the SELECT clause.
3) As an operand in Boolean expressions. This is when we use subquery in WHERE or HAVING clauses.
The SELECT Statement
SELECT statement is special. Only in the SELECT statement we can use subquery as a source table, or an expression column.
Subquery as a Source Table
We can read our data from subquery. In this case subquery replaces the source table.SELECT * FROM innerQuery; The distinguishing element of each subquery is parentheses. They are always mandatory. If we are using subquery as the source table, then we must also use the alias. |  |
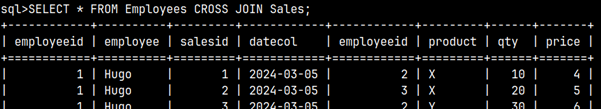
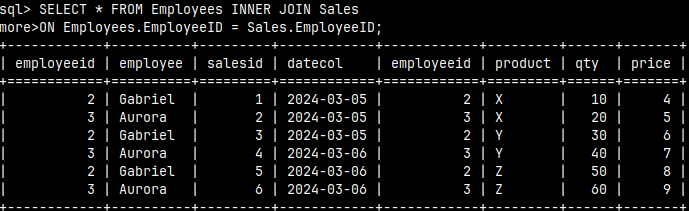
SELECT * |  | It is possible to use a subquery within a JOIN clause. |
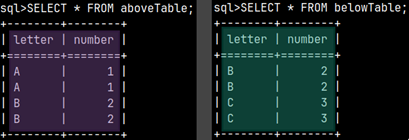
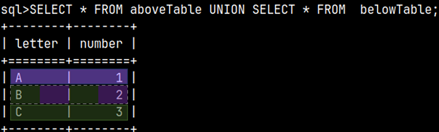
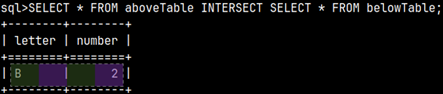
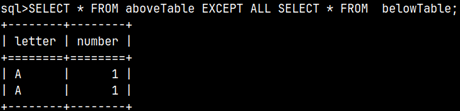
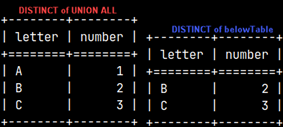
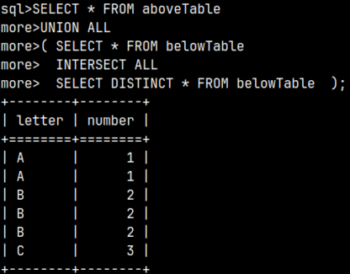
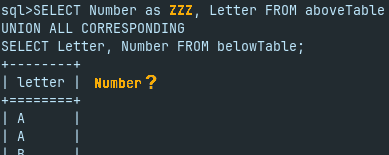
SELECT * FROM |  | We can also create a union between two subqueries and then use that union in the FROM clause. This means that we can combine several subqueries into one, using set operators. |
Subquery as a Column Expression
If a subquery returns a scalar, we can use that value directly as a column value.
SELECT 3, ( SELECT 5 + 5 ); |  | SELECT *, ( SELECT 5 + 2 ) columnAlias |  |
Subquery as an Operand of a Boolean Expression
In SQL expressions we can work with scalars and with tables. These are the two data structures that exist in SQL.
SELECT '7'; | This will return the scalar. | SELECT * FROM Table1; | This will return the table. |
Once we get the result of a SELECT statement, we can use that result as an operand in Boolean expression. We need operators for expressions. Let's see what kind of operators we can use.
Comparison Operators
If the SELECT query returns a scalar, we can use that value with the comparison operators "=, <>, >, >=".
 | SELECT ( 2 = ( SELECT Number FROM innerQuery WHERE Letter = 'B' ) ) AS Result; This is the same as the statement: SELECT ( 2 = 2 ) AS Result;The inner query will return the number 2, which we will use in our expression. |
For all operators we can negate the result with the NOT prefix.
 | SELECT ( NOT 2 = ( SELECT Number FROM innerQuery WHERE Letter = 'B' ) ) AS Result; This prefix will transform a "true" result into a "false" result. |
IN Operator
The IN operator will check if a value belongs to a set. We can negate IN with NOT IN.
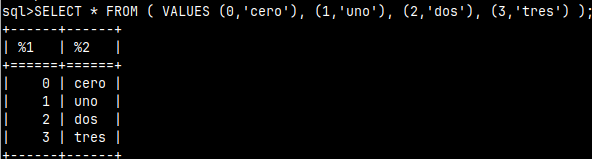
 | SELECT 2 IN ( SELECT Number FROM innerQuery ) AS Result;The statement above is similar to the statements below. They all would get the same result. SELECT 2 IN ( 2, 2 ) AS Result; SELECT 2 IN ( VALUES (2),(2) ) AS Result; |
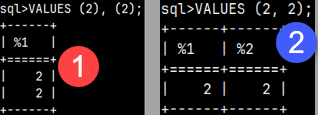 | The statement "VALUES (2), (2)" will return a column. The statement "VALUES ( 2, 2 )" will return a row.When we use the IN operator, we always have to use only one column. In some databases this statement below will work but this will not work in MonetDB. We can only use one column with the IN operator. SELECT ( 2, 2 ) IN ( VALUES ( 2, 2 ) ); |
ALL and ANY
Comparison operators can be made more powerful by combining them with the ALL or ANY operators.
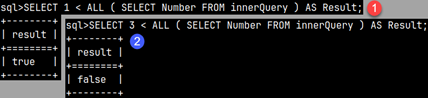 | The "Number" column from the innerQuery table has the values 2 and 3. In the example (1), we check whether ( 1 < 2 ) AND ( 1 < 3 ). The result is TRUE. SELECT 1 < ALL ( SELECT Number FROM innerQuery ) AS Result;In example (2), we check whether the number 3 is smaller than all the numbers from the innerQuery table, ( 3 < 2 ) AND ( 3 < 3 ). It is not, this expression returns false. SELECT 3 < ALL ( SELECT Number FROM innerQuery ) AS Result; |
ANY is less demanding than ALL. With ANY, we ask "is there some number in the innerQuery table that will make our comparison TRUE?".
 | SELECT 2 < ANY ( SELECT Number FROM innerQuery ) AS Result;ANY is using OR logic, ( 2 < 2 ) OR ( 2 < 3 ). SELECT 2 < ALL ( SELECT Number FROM innerQuery ) AS Result;ALL is using AND logic ( 2 < 2 ) AND ( 2 < 3 ). |
EXISTS, or NOT EXIST
Sometimes we just want to test whether a query is empty or not. We use the EXISTS operator for that.
 | Our table does not have the letter 'Z', so the subquery will be empty. That's why the EXISTS operator returns FALSE. SELECT EXISTS ( SELECT * FROM innerQuery WHERE Letter = 'Z' ) AS Result; |
Conclusion
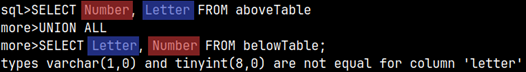
1) We can only compare compatible data types. We cannot compare apples and pears (numbers and strings).
2) The result of all expressions involving a subquery is Boolean.
3) When using subquery operators, the subquery can be on both the left and right sides. Some databases do not allow subqueries to be on the left. MonetDB is not like that.
 | This subquery is on the left side of operator. It is custom to place subquery on the right side, and I will follow that convention. |
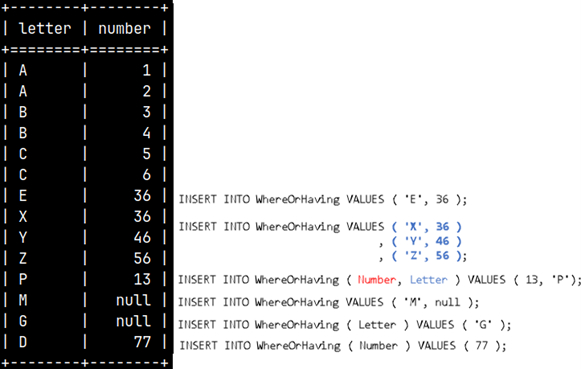
Subquery in WHERE or HAVING clauses
Now that we know how to use subquery in a Boolean expression, we can use it in WHERE or HAVING clauses. We can use HAVING in SELECT statement, but WHERE can be used in SELECT, UPDATE or DELETE statements. Let's look at some examples:
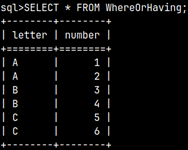
 | SELECT Letter, SUM( Number ) AS Total FROM GROUP BY Letter;We will create a union of our two tables to group them together. | This SELECT statement will be used as an operand. It will return a result of 2.5.SELECT AVG( Number ) FROM innerQuery; |
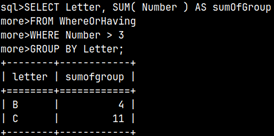
SELECT Letter, SUM( Number ) AS Total FROM FROM innerQuery ); | We will combine the two statements above into one. We will filter only those groups in which the SUM(number) values are greater than 2.5. |  |
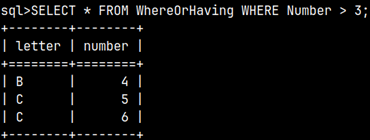
These are two examples with WHERE.
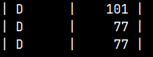
UPDATE outerQuery |  | The subquery will return the numbers 2 and 3. Therefore, the number 2 from the outer query will be updated to the number 5. |  |
We can return the number 2 using the following statement.
UPDATE outerQuery |  | The number 5 is now greater than all numbers from innerQuery. So we're going to move it back to number 2. |  |
Now it's easy to understand why I named my tables outerQuery and innerQuery. We used outerQuery for the main query, and innerQuery table for the subquery.
Correlated Subquery
A correlated subquery is a special type of subquery. It is extremely powerful, but its performance is dismal. In real life, where we have large tables, using correlated subqueries will kill performance. We can still use it successfully on small tables.
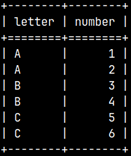
SELECT oq.Letter, oq.Number, ( SELECT iq.Number FROM innerQuery iq WHERE iq.Number = oq.Number ) AS siblingNumber; | In a correlated subquery, we execute the subquery once for each row of the outer query. The subquery uses the value from the outer query as its parameter. This can be better understood in the table below. |
For each row, we execute the inner query once. For the WHERE parameter of the inner query, we take the value from the outer query. This is how a correlated subquery works.
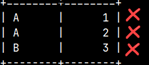
| outerQuery.Letter | outerQuery.Number | siblingNumber |  | |
| A | 1 | SELECT Number FROM innerQuery WHERE Number = 1 | => Returns null | |
| B | 2 | SELECT Number FROM innerQuery WHERE Number = 2 | => Returns 2 |
Correlated subquery can be used in SELECT, HAVING, WHERE clauses. A subquery is a correlated subquery if it uses a value from an outer query as a parameter.
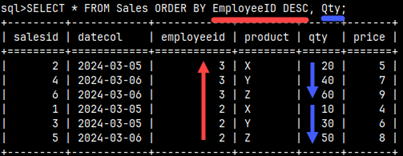
Order By
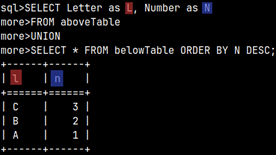
In MonetDB, subqueries can use the ORDER BY clause.
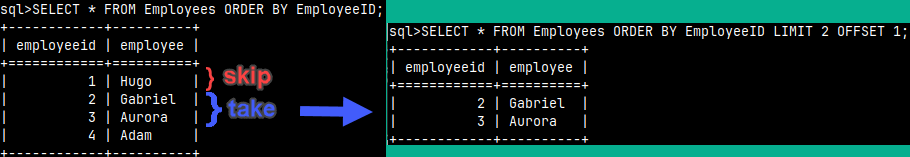
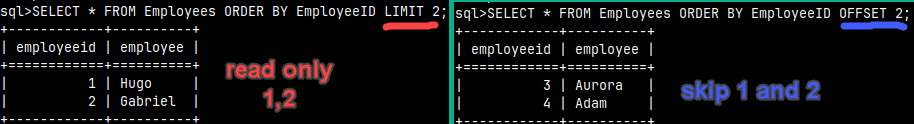
SELECT * FROM |  | In some other databases this is only allowed if the subquery uses LIMIT or OFFSET specifiers. |