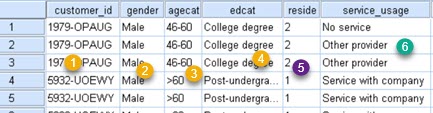
Our table has data about cable television users. We have ID of the customers (1), their gender (2), age group (3) and education level (4). Column "reside" (5) shows how many people live in the household. Column "service_usage" (6) shows what kind of cable service they use. We will see how to filter this data in different ways in SPSS program.
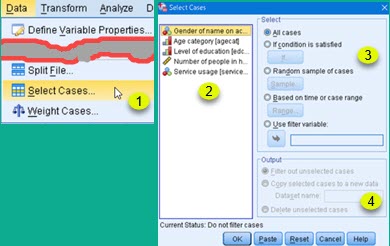
On the image on the right we can see that filtering dialog is opened by clicking on Data > Select Cases (1). This opens dialog where we can select columns to filter (2), we can choose how to filter (3), and we can decide what will happen with filtered data (4).
5 ways to filter data
All cases 
"All cases" option means that there will be no filtering. This is the default.
If condition is satisfied 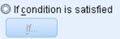
This option opens dialog where we can define formula that will filter data. We can click on column names (1), math and number symbols (2), and we can choose some of built-in functions (3). What we click, will appear in pane (6). We can also type by hand what we want in pane (6). Whole expression can be typed manually, but it is more easier to select elements of expression. Pane (5) will filter functions presented in the pane (3). This will help us to find function we want. When we select one of the functions in the pane (3), we can see its syntax and description in the pane (4).
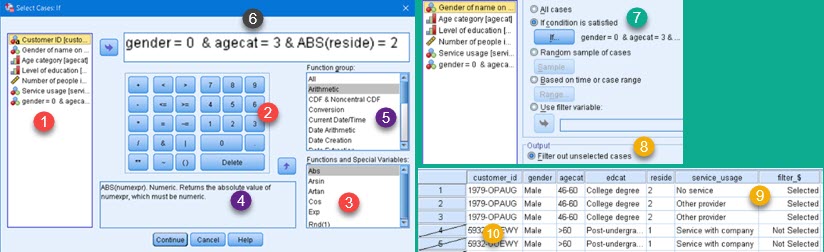
Now that we created our filter (7), we will choose to "Filter out unselected cases" (8). This option will not hide or delete filtered data (9), but will only mark it as filtered (10). Although still visible, marked rows will not be included in SPSS calculations. This way we don't loose any data and we can after, apply some other filter on our table.
Random sample of cases 
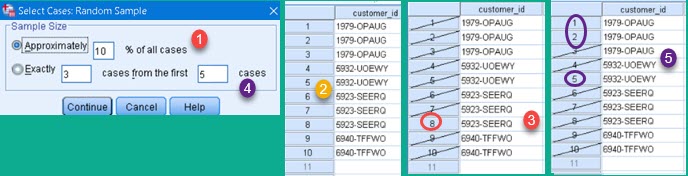
Button "Sample" opens dialog where we can use one of two possible random filters. First filter (1) will choose some percent of all the cases randomly. For this to show, I will use smaller table that has only 10 rows (2). If we choose to filter 10% of rows, only one row will be left (3). Other option (4) is to randomly select a limited number of rows from the specified number of first cases. We choose to select 3 rows from the first 5 rows, so only rows 1, 2 and 5 will be selected (5).
Base on time or case range 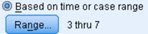
 | We can just choose one continuous range of cases. On image left, we can see (1) that we have chosen all cases between case 3 and 7 inclusively. All other cases will be crossed out (2). |
Use filter variable 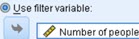
 | This option asks from us to select one of the columns (1). This column should have rows without data (2). All the rows where that columns doesn't have data will be filtered (3). |
What will happen with filtered data?
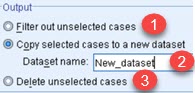 | Filtered data can be marked as filtered out and such rows will be excluded from further calculations (1). There are two more options. First is to create new Dataset(2). SPSS will open a new window. That window will show all the rows, but unselected rows will be crossed out. Other possibility is to delete cases that don't pass filter condition. Our Dataset will be then reduced by deleting not needed rows (3). You should be careful when deleting the rows because deleting can not be undone. |
Sample data can be downloaded from here: