Our Model
We will use this simple model to explain SUMMARIZECOLUMNS function. On the left side we have ProductCategory > ProductSubcategory > Product. On the right side we have "Calendar" table. "Sales", the fact table is in the middle.

Grouping Columns
In its simplest form, this function just groups values from several columns. If the columns do not belong to the same table, the result will be a cross join of their values.
 | EVALUATE SUMMARIZECOLUMNS( ProductCategory[ProductCategory] , Calendar[Year] ) ORDER BY ProductCategory[ProductCategory] , Calendar[Year] |
But if the columns are from the same table, then only distinct rows of those columns will be returned.
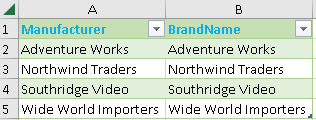 | EVALUATE SUMMARIZECOLUMNS( Product[Manufacturer] , Product[BrandName] ) ORDER BY Product[Manufacturer] , Product[BrandName] |
If the first table above has 24 rows, and the second has 4 rows, then the formula below will give us a table with 4 * 24 = 96 rows. The formula below combines all four columns.
| EVALUATE SUMMARIZECOLUMNS( ProductCategory[ProductCategory], Calendar[Year] , Product[Manufacturer] , Product[BrandName] ) ORDER BY ProductCategory[ProductCategory], Calendar[Year] , Product[Manufacturer] , Product[BrandName] |
Filter Table Argument
We don't need to combine all the values from the columns, we can apply filters on them. Any table mentioned after grouping columns will be considered as a filter.
  this is filter table created with TREATAS function. this is filter table created with TREATAS function. This is why we only have two categories in our table. | EVALUATE SUMMARIZECOLUMNS( ProductCategory[ProductCategory] , Calendar[Year] , Product[Manufacturer] , Product[BrandName] , TREATAS( { "Audio", "Cameras and camcorders" } , ProductCategory[ProductCategory] ) ) ORDER BY ProductCategory[ProductCategory] , Calendar[Year] , Product[Manufacturer] , Product[BrandName] |
It is possible to use several filter tables. Each table will filter the columns that belong to it.
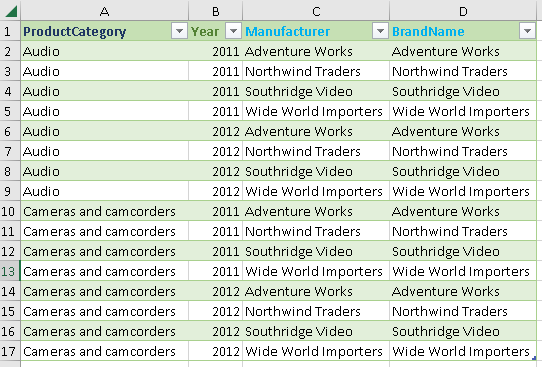 TREATAS function. One will apply a filter to the "ProductCategory" column, and the other to the "Year" column. | EVALUATE SUMMARIZECOLUMNS( ProductCategory[ProductCategory] , Calendar[Year] , Product[Manufacturer] , Product[BrandName] , TREATAS( { "Audio", "Cameras and camcorders" } , ProductCategory[ProductCategory] ) , TREATAS( { 2011, 2012 }, Calendar[Year] ) ) ORDER BY ProductCategory[ProductCategory] , Calendar[Year] , Product[Manufacturer] , Product[BrandName] |
The grouping column must be part of the filter table, for the filter to apply.
Aggregations
Now we can add some aggregations. Aggregations are defined by the the name of the new column, and then we add some expression that returns a scalar value.
The SUMMARIZECOLUMNS function was born for this. This is the fastest and easiest function to group columns from several tables and then add some aggregated values from a fact table. A lot of work can be done with just one function.
 *In the source data, we only have Sale for this two product categories. | EVALUATE SUMMARIZECOLUMNS( ProductCategory[ProductCategory] , ProductSubCategory[ProductSubCategory] , "SalesQuantity", SUM( Sales[SalesQuantity] ) , "SalesAmount", SUM( Sales[SalesAmount] ) ) ORDER BY ProductCategory[ProductCategory] , ProductSubcategory[ProductSubcategory] |
NONVISUAL
Filter Table argument can do two things. It can affect the number of rows, and it can also affect the measurements. Let's make one measure:
TotalSalesAmount:=SUM( Sales[SalesAmount] )
As you can see below, we just summed the two subcategories with the measure TotalSalesAmount ( 339.112.125 ). The measure is influenced by the filter table argument. We can notice that if we display all the data, then the total amount of sales would be 416.455.001.
 | EVALUATE SUMMARIZECOLUMNS( ProductSubcategory[ProductSubcategory] , TREATAS( { "Recording Pen", "Televisions" } , ProductSubcategory[ProductSubcategory] ) , "SalesQuantity", [TotalSalesAmount] , "SalesAmount", CALCULATE( [TotalSalesAmount], ALLSELECTED( Sales ) ) ) ORDER BY ProductSubcategory[ProductSubcategory] |
We can remove the filter table influence on the measure by wrapping it in a NONVISUAL function. This time our TotalSalesAmount is exactly 416.455.001. The image below is from PBID, as this NONVISUAL function was not introduced into Excel.
 | EVALUATE SUMMARIZECOLUMNS( ProductSubcategory[ProductSubcategory] , NONVISUAL( TREATAS( { "Recording Pen", "Televisions" } , ProductSubcategory[ProductSubcategory] ) ) , "SalesQuantity", [TotalSalesAmount] , "SalesAmount", CALCULATE( [TotalSalesAmount], ALLSELECTED( Sales ) ) ) ORDER BY ProductSubcategory[ProductSubcategory] |
IGNORE
When we apply aggregations, rows where all measures are blank, will be excluded from the result.
We use VALUES function because there is no row context in the SUMMARIZECOLUMNS function.
| EVALUATE SUMMARIZECOLUMNS( ProductCategory[ProductCategory] , "SalesQuantity", IF( VALUES( ProductCategory[ProductCategory] ) = "TV and Video" , BLANK(), SUM( Sales[SalesQuantity] ) ) , "SalesAmount", IF( VALUES( ProductCategory[ProductCategory] ) = "TV and Video" , BLANK(), SUM( Sales[SalesAmount] ) ) ) ORDER BY ProductCategory[ProductCategory] |
We can use the IGNORE function to treat some measures as they were blank. If some of the measures values are blank, and others are IGNORED, then such rows will not be part of a result.
 | EVALUATE SUMMARIZECOLUMNS( ProductCategory[ProductCategory] , "SalesQuantity", IF( VALUES( ProductCategory[ProductCategory] ) = "TV and Video" , BLANK(), SUM( Sales[SalesQuantity] ) ) , "SalesAmount", IGNORE( SUM( Sales[SalesAmount] ) ) ORDER BY ProductCategory[ProductCategory] |
Using IGNORE on all the rows will not hide all data. Contrary, it will display all of the rows.
 | EVALUATE SUMMARIZECOLUMNS( ProductCategory[ProductCategory] , "SalesQuantity", IGNORE( SUM( Sales[SalesQuantity] ) ) , "SalesAmount", IGNORE( SUM( Sales[SalesAmount] ) ) ORDER BY ProductCategory[ProductCategory] |
ROLLUPADDISSUBTOTAL
ROLLUPADDISSUBTOTAL basics
SUMMARIZECOLUMNS can have subtotals and grandtotal calculated using the ROLLUPADDISSUBTOTAL helper function. This function accepts at least two arguments. First is the column used for grouping. For the items in this column, we would get subtotals. The second argument is the name of the new column which will say TRUE or FALSE depending on whether that row is a detail row or a subtotal row.
In the image bellow we can see three new rows with subtotals. There is, also, one more column that shows whether the row is a subtotal for a particular column ( TRUE or FALSE ).
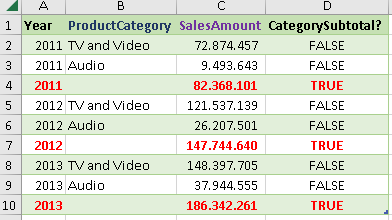 | EVALUATE SUMMARIZECOLUMNS( Calendar[Year] , ROLLUPADDISSUBTOTAL( ProductCategory[ProductCategory], "CategorySubtotal?" ) , "SalesAmount", [TotalSalesAmount] ) ORDER BY Calendar[Year] ASC , ProductSubcategory[ProductSubcategory] DESC |
This happens if we wrap each grouping column with ROLLAPADDISSUBTOTAL. We get all possible subtotals.
 | EVALUATE SUMMARIZECOLUMNS( ROLLUPADDISSUBTOTAL( Calendar[Year], "YearSubtotal?" ) , ROLLUPADDISSUBTOTAL( ProductCategory[ProductCategory], "CategorySubtotal?" ) , "SalesAmount", [TotalSalesAmount] ) ORDER BY Calendar[Year] ASC , ProductCategory[ProductCategory] DESC |
It is possible to place all the grouping columns together in a singe ROLLUPADDISSUBTOTAL function. In that case, we would get hierarchical subtotals, from left to right ( like in Excel pivot table ).
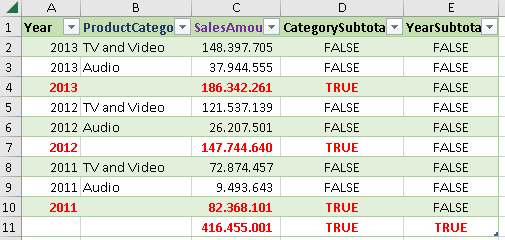 | EVALUATE SUMMARIZECOLUMNS( ROLLUPADDISSUBTOTAL( Calendar[Year], "YearSubtotal?" , ProductCategory[ProductCategory], "CategorySubtotal?" ) , "SalesAmount", [TotalSalesAmount] ) ORDER BY Calendar[Year] DESC, ProductCategory[ProductCategory] DESC |
ROLLUPADDISSUBTOTAL filters
We can create a single filter table. We can place this filter table in the ROLLAPADDISSUBTOTAL function and that way we can filter our subtotals and grand total. We can place this argument at the beginning, and at the end of ROLLUPADDISSUBTOTAL function. At the start it would only filter the value of grand total. At the end, it would filter only column items.
In this example below we place it in both places. This would filter both the grand total and the items. The images are from PBID because this argument is not introduced into Excel.
 | VAR RollupFilter = TREATAS( { "Recording pen"}; OnlyNeeded[ProductSubcategory] ) VAR Result = SUMMARIZECOLUMNS( ROLLUPADDISSUBTOTAL( RollupFilter ; OnlyNeeded[ProductSubcategory] ; "SubcategorySubtotal?" ; RollupFilter ) ; "SalesAmount"; [TotalSalesAmount] ) RETURN Result |
This would be the results if we placed this argument only at the beginning, or only at the end of the ROLLUPADDISSUBTOTAL function.
At the beginning, it influence only grand total. | At the end, it influence only subtotals. |
ROLLUPGROUP
By placing some columns in a ROLLUPGROUP, we will observe them together. That is why their individual subtotals will not appear in our table. If we want to exclude some subtotals, we use ROLLUPGROUP.
In this example we don't have subtotals for ProductCategory and SubCategory. They are excluded because we placed this two columns in the ROLLUPGROUP function.
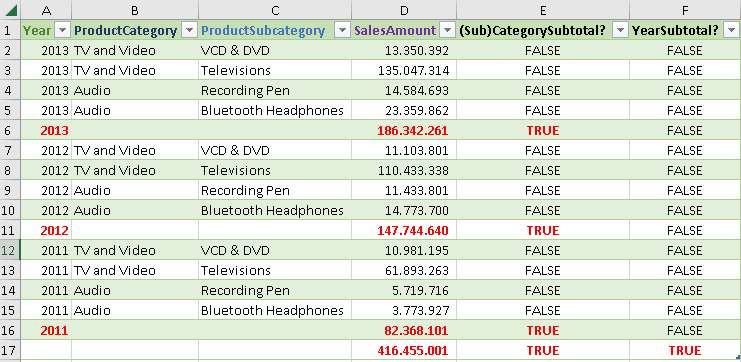 | EVALUATE SUMMARIZECOLUMNS( ROLLUPADDISSUBTOTAL( Calendar[Year] , "YearSubtotal?" , ROLLUPGROUP( ProductCategory[ProductCategory] , ProductSubcategory[ProductSubcategory] ) , "(Sub)CategorySubtotal?" ) , "SalesAmount" , [TotalSalesAmount] ) ORDER BY Calendar[Year] DESC , ProductCategory[ProductCategory] DESC , ProductSubcategory[ProductSubcategory] DESC |
Sample file can be downloaded from here: