Simplest usage
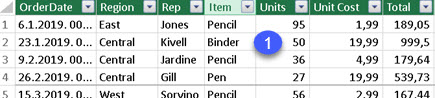
In its simplest form SUMMARIZE can be used to get distinct values from several columns. We have sample data in the table named SampleTable (1).
 |
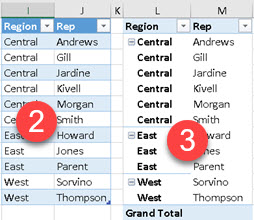
| By using SUMMARIZE we can get all distinct combinations of values from columns Region and Rep (2). This is the same what happens when we place those two columns into pivot table (3). |
| This is the formula we used to create (2). EVALUATE SUMMARIZE( SampleTable, [Region], [Rep] ) ORDER BY [Region], [Rep] |
SUMMARIZE can work with columns from related tables. We added table (1) with unique values for Representatives, and we made a relation (2) between that table and original "Rep" column. Now, we can still use SUMMARIZE function that will use this new RepDetached column. Note, that this will only work for 1:N relations, where table mentioned in SUMMARIZE function is on "N" side of relation.
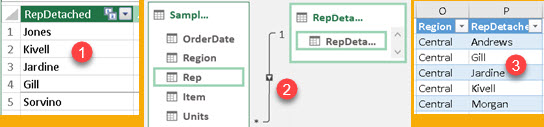 | Result will be the same (3). EVALUATE SUMMARIZE( SampleTable, [Region], [RepDetached] ) ORDER BY [Region], [RepDetached] |
SUMMARIZE With Aggregations
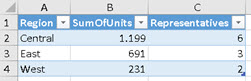
By using aggregations, we can add summary columns in the final table. We can aggregate values from current table and from related table. We can give new names to those columns.
EVALUATE
SUMMARIZE( SampleTable, [Region], "SumOfUnits", SUM( SampleTable[Units] )
           , "Representatives", DISTINCTCOUNT( RepDetached[RepDetached] ) )
ORDER BY [Region]
ROLLUP
Rollup is helper function that will provide us Grand Total and all other subtotals for our hierarchy.
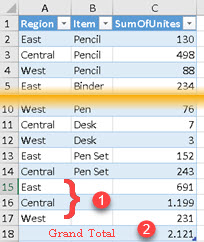 | We are grouping table by Region and Item. We will get subtotal for each Region (1), and we will get grand total (2). They will be added as a new rows at the bottom of the table.EVALUATE SUMMARIZE( SampleTable, Rollup( [Region], [Item] ) , "SumOfUnites" , SUM( SampleTable[Units] ) )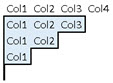 In this case, order of columns is important, because subtotals will be calculated following hierarchy from left to right. |
ROLLUPGROUP
ROLLUPGROUP is another helper function. It is used in combination with ROLLUP function. Purpose of ROLLUPGROUP function is to exclude subtotals for some columns from the final result of SUMMARIZE.
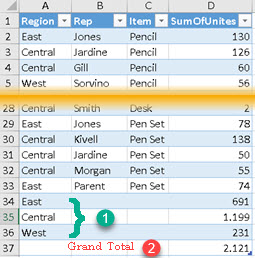 | This time we have three columns for grouping. We always have Grand Total (2) when we use ROLLUP. We left "Region" column outside of ROLLUPGROUP function. This means that we will have subtotals for "Region" column (1). For "Rep" and "Item" columns, there will be no subtotals that include those two columns. This is because those columns are inside ROLLUPGROUP function. EVALUATE SUMMARIZE( SampleTable, Rollup( [Region], ROLLUPGROUP( [Rep], [Item] ) ) , "SumOfUnites", SUM( SampleTable[Units] ) ) |
ISSUBTOTAL
ISSUBTOTAL is a function that informs whether current row is a subtotal row for some column. This function receives an argument that is one of the columns included in the ROLLUP function. If that column is aggregated by subtotal in the current row, then ISSUBTOTAL function will return TRUE in that row.
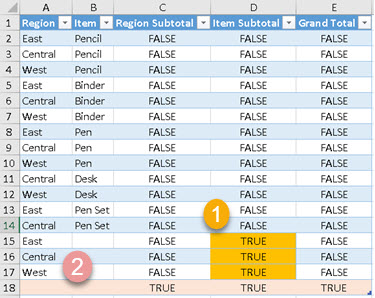 | Formula bellow is making rollup for "Region" and "Item" columns. EVALUATE SUMMARIZE( SampleTable, Rollup( [Region], [Item] ) , "Region Subtotal", ISSUBTOTAL( [Region] ) , "Item Subtotal", ISSUBTOTAL( [Item] ) , "Grand Total", ISSUBTOTAL( [Region] ) && ISSUBTOTAL( [Item] ) ) For those two columns we can find out whether they have subtotal in the current row. We can see that ISSUBTOTAL( [Item] ) returns TRUE in the rows (1). ISSUBTOTAL ( [Region] ) returns TRUE only in Grand Total (2). In Grand Total, both columns are returning TRUE. |
Filter and Row Context
SUMMARIZE can create new columns in row context. Only the columns used for grouping can be used (Region and Item).
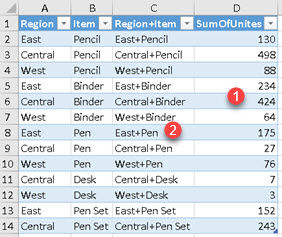 | In the image, we can see that beside creating aggregate column (1), we can also create column (2) that doesn't use aggregation. This column is made by using row context. Formula for creation of our table is: EVALUATE SUMMARIZE( SampleTable, [Region], [Item] , "Region+Item", [Region] & "+" & [Item] , "SumOfUnits", SUM( SampleTable[Units] ) ) |
Nested grouping
We can first group our data by columns "Region" and "Item" (1). Then, we want to group table (1) by "Region" column (2).
 | We can't nest SUMMARIZE functions. SUMMARIZE function expects fully qualified column as column used in aggregation. This means that outer SUMMARIZE function would not be able to accept "SumOfUnits" column. |
The easiest way to solve this problem is to use another grouping function, "GROUPBY", as outer function. This function will accept "SumOfUnits" column name without table quailifier.
EVALUATE
VAR SummarizeFunction = SUMMARIZE( SampleTable, [Region], [Item]
                                 , "SumOfUnits", SUM( SampleTable[Units] )    )
VAR GroupByFunction = GROUPBY( SummarizeFunction, [Region]
                             , "SumOfUnits2", SUMX( CURRENTGROUP(), [SumOfUnits] )   )
RETURN GroupByFunction
If we do not use aggregated column in SUMMARIZE function, then nesting is possible:
EVALUATE
SUMMARIZE(
   SUMMARIZE( SampleTable, [Region], [Item] )
   , [Region]
)
How does SUMMARIZE function work?
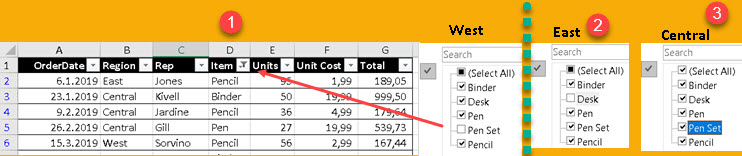
Most of us know how advanced filter in Excel works.
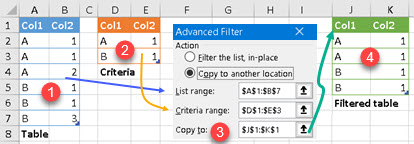 | Table (1) and Criteria table (2) are used by Advanced filter (3) to produce filtered table (4). Important thing here is "Criteria table". Criteria table is saying that only rows which have values (A,1) or (B,1) in columns (Col1,Col2) should pass the filter. |
This "Criteria table" is how filter context is defined in Power BI. Filter context is a table. What filter context table do we expect is used, when aggregate values are calculated in SUMMARIZE function? We expect that filter context table has only columns that are used for grouping. We could graphically represent this like:
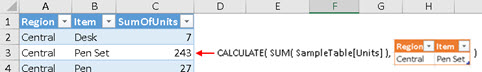
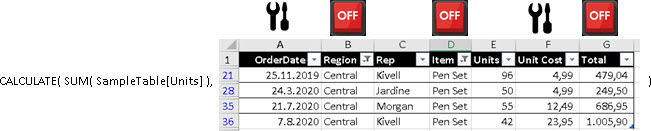
But, this is not how SUMMARIZE filter works. On our surprise, this is how SUMMARIZE really creates its filter. SUMMARIZE will first filter original SampleTable with region "Central" and item "Pen Set" (1). After this, whole table segment (2) will be used as a filter context.
The reason why SUMMARIZE works like this is because SUMMARIZE has full ability to control filter context of aggregated values with CALCULATE function. We can disable or modify some of the filters.
Example
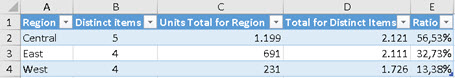
Let's assume that we can not sell "Desk" item in "East" region and we can not sell "Pen Set" item in "West" region because of the government. We want to know what is the share of each Region in all the units sold, but only for items that are allowed for that Region. We can accomplish this by using only one function – SUMMARIZE.
In the image bellow, we can see that "Central" region is selling all of the 5 items (column "B"). That is why we compare its sale with 2.121 units (column "D") which is total number of units for all the regions. For "East" and "West" this number is 2.111 and 1.726 because those totals are corrected not to include items "East" and "West" region are not allowed to sell.
EVALUATE
SUMMARIZE( SampleTable
, [Region]
, "Distinct items", DISTINCTCOUNT( SampleTable[Item] )
, "Units Total for Region", SUM( SampleTable[Units] )
, "Total for Distinct Items"
, CALCULATE( SUM( SampleTable[Units] ), ALLEXCEPT( SampleTable, SampleTable[Item] ) )
, "Ratio", SUM( SampleTable[Units] )
/ CALCULATE( SUM( SampleTable[Units] ), ALLEXCEPT( SampleTable, SampleTable[Item] ) )
)
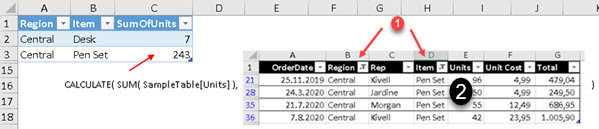
ORDER BY [Region]In our formula, blue part is removing all filters except filter for items, when calculating Total sale. So, we don't filter "Region" column in our filter context. In the image bellow we can see how this influence filter context for "West" region. For "West" region filter context is the whole SampleTable with rows that contains "Pen Set" item removed (1). It is similar for "East" (2). For "Central" we don't filter SampleTable at all (3). That is why column "D" has the biggest value for "Central" region and smaller values for "West" and "East" region.
Performance Consequence
Because of the complexity of how SUMMARIZE function creates its filter context, performance of this function will not be impressive. We should use this function only when we need distinct rows for several columns (simplest case) or when we want to modify filter context (the most complex case).
Sample file can be downloaded from here: