Description of data
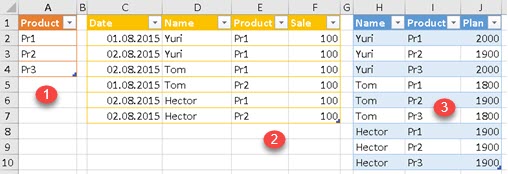
We have three tables below. Table (1) shows all products we sell. Table (2) shows our sale in first two days of a month. Note that we still didn't have sale for Product 3 in that month. In third table (3) we have month plan defined for each Salesman/Product combination.
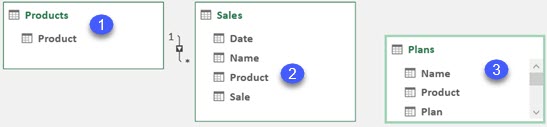
In our model we will connect the first (1) and the second (2) table with a relation. Plan (3) will be detached table and we will use measure to get our plan values.
"Show items with no data on rows" pivot table option
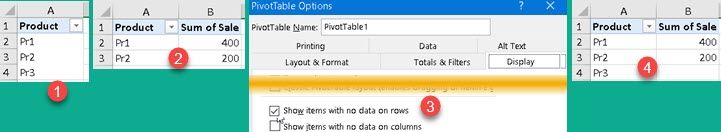
If we add column Products[Product] into pivot table (1), all three products will be shown. After we add column Sales[Sale] to the same pivot table, only two products will remain (2). This is consequence of the fact that we didn't have any Product 3 sales. This behavior could be changed by enabling option "Show items with no data on rows" (3) in the pivot table options. Now, we can see that all the three products are presented (4).
Problem description
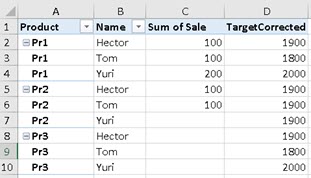
We will start with a pivot table (1) below. Option "Show items with no data on rows" is enabled. This pivot table has no Grand Total in order to make things simpler. Then, we will create measure [Target] (2) which will add Plans[Plan] values into our pivot table. This measure will use DISTINCT function. As we can see, rows 7-10 in image (3) will have no plan values, although we have them defined. The reason for this is in the expression DISTINCT( Sale[Name] ). This expression will return BLANK() for each row where [Sum of Sale] is also BLANK(). That is consequence of the fact that in Sales table there are no rows with Product/Name combinations like in rows 7-10. DISTINCT function is trying to read directly from table Sales, but there are no rows to read from.
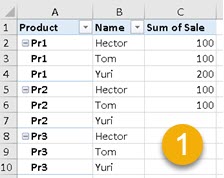 | Target:=CALCULATE( SUM( Plans[Plan] ) ; Plan[Name] = DISTINCT( Sale[Name] ) ; Plan[Product] = DISTINCT( Products[Product] ) ) (2) |  |
Solution
Instead of DISTINCT function, we should have used FILTERS function. This function accepts only one column argument. It returns all of values that are filtered from that column. Let's make two simple measures "DistinctReturn:=DISTINCT( Sales[Name] )" and "FiltersReturn:=FILTERS( Sales[Name] )" to see difference between them.
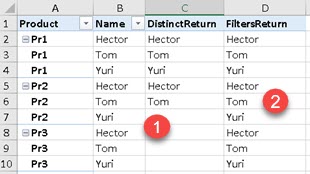
DISTINCT (1) will not return anything for rows 7-10 as we saw earlier. FILTERS (2) function will return "Yuri" in cell "D7" because column Sale[Name] is filtered by only that value in that specific row. That is why column [FiltersReturn] has result in each row, because it is reading filter context for column Sales[Name], and is not reading from Sales[Name] column itself. Column Sales[Name] is reduced to nothing in cell "C7" because there are no rows with "Pr2 & Yuri" combination in the Sales table.
Now, that we know, what is the problem, we can create correct expression for Target measure. We only need one small change. We have to replace DISTINCT with FILTERS function to get correct result.
Target:=CALCULATE( SUM( Plans[Plan] ); Plans[Name] = DISTINCT( Sales[Name] )
    ; Plans[Product] = DISTINCT( Products[Product] ) )
TargetCorrected:=CALCULATE( SUM( Plans[Plan] ); Plans[Name] = FILTERS( Sales[Name] )
    ; Plans[Product] = DISTINCT( Products[Product] ) )
And finally, we have a required result:
Sample file can be downloaded here: