Requirement
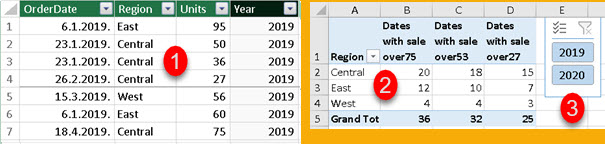
We have a table like (1). This tables shows how many units of product has been sold on each date in each region. We want to get pivot table (2) that shows how many days, sale was bigger than 75, 53 or 27 units. We want to observe those values per year so we added a slicer for years (3).
Needed calculations
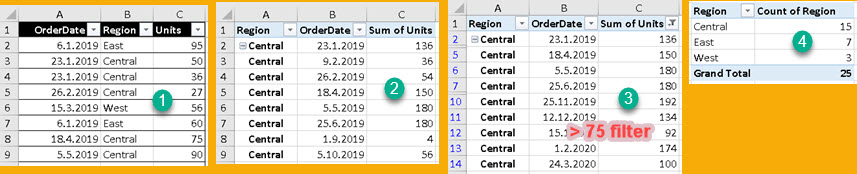
If our data is (1), first we need to group our data by Region and OrderDate and to calculate sum of units for each group (2). That table we have to filter for values bigger than 75 (3). Then, again, we have to do grouping by Region and to count rows from our filtered table (4). We also have to repeat this for values 53 and 27.
Slow solution
For this calculation we could create three measures that look like the one bellow. If we have a lot of data, after clicking on slicer we would have to wait a lot for calculation to finish. Not only we do have a lot of data, but we also have demanding calculation for each measure, and we have three such measures.
MeasureOver75:=
VAR GroupByRegionOrderDate = GROUPBY( SampleTable; [Region]; [OrderDate]; "SumOfUnits"; SUMX( CURRENTGROUP(); [Units] ) )
VAR FilterOver75AndCount = COUNTROWS( FILTER( GroupByRegionOrderDate; [SumOfUnits] >= 75 ) )
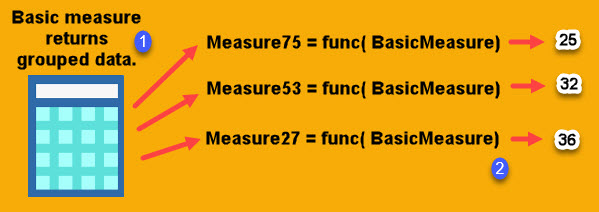
RETURN FilterOver75AndCountAll three measures starts with the same step ( "GroupByRegionOrderDate" ). This step is very expensive because it is the one doing most of calculations. This step returns table. If we could just do this step once instead of repeating it for each measure, that would be great. We could make a basic measure that returns such table (1), and then three other measures that would use that table to calculate final scalar values (2).
Unfortunately, measures can not return table. They can only return scalar.
Better solution
Better solution is to create one measure that returns all three values. We can simply concatenate three numbers in one string ( "25-32-36" ). That would be result of our Basic measure. Then we can create three measures that would extract separate values. This could be our Basic measure code:
BasicMeasureString:=
VAR GroupByRegionOrderDate = GROUPBY( SampleTable; [Region]; [OrderDate]; "SumOfUnits"; SUMX( CURRENTGROUP(); [Units] ) )
VAR BiggerThen75 = COUNTROWS( FILTER( GroupByRegionOrderDate; [SumOfUnits] >= 75 ) )
VAR BiggerThen53 = COUNTROWS( FILTER( GroupByRegionOrderDate; [SumOfUnits] >= 53 ) )
VAR BiggerThen27 = COUNTROWS( FILTER( GroupByRegionOrderDate; [SumOfUnits] >= 27 ) )
VAR Result = BiggerThen75 & "-" & BiggerThen53 & "-" & BiggerThen27
RETURN Result
It would return string „25-32-36". Then we can use three additional measures to extract three separate values:
FirstPartOfString:=VALUE( LEFT( [BasicMeasureString]; 2 ) )             //returns 25
MiddlePartOfString:=VALUE( MID( [BasicMeasureString]; 4; 2 ) )    //returns 32
LastPartOfString:=VALUE( MID( [BasicMeasureString]; 7; 2) )          //returns 36
As we see, we only do step „GroupByRegionOrderDate" once. This way we make our calculation much faster. If our final results are numbers, we could get results even faster by using mathematical calculations to extract our values, instead of doing string manipulations. In our Basic measure we could combine three values into one value like this:
VAR Result = BiggerThen75 * 10000 + BiggerThen53 * 100 + BiggerThen27 //returns 253236Then, we can extract separate numbers by using INT and MOD functions like this:
Dates with sale over75 := INT( [BasicMeasure] / 10000 ) //returns 25
Dates with sale over53 := INT( MOD( [BasicMeasure]; 10000 ) / 100 ) //returns 32
Dates with sale over27 := MOD( [BasicMeasure]; 100 ) //returns 36
Solution with math calculations would be significantly faster.
Sample file can be downloaded here: