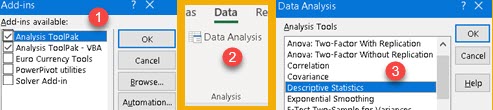
Analysis ToolPak is an Excel add-in that provides many statistical tools. This add-in comes in two flavors, and each of them has to be enabled in "Add-ins" dialog (1) in order to use it. They both have the same functionality but "Analysis ToolPak" has its functionality available only through graphical interface. "Analysis ToolPak – VBA" is accessible both through graphical interface and VBA code.
After we enable "Analysis ToolPak" (1), a button will appear in Data > Analysis (2). By clicking on that button, we will open dialog with many statistical tools (3). In order to use any of these tools we just have to select it and click on OK. New dialog will appear which provides options for that specific statistical tool.
Descriptive Statistics
Descriptive statistics is based on a brief descriptive coefficients that quantitatively describe or summarize features of a data set. Data set is set of results of measurements made on a population or a sample. This coefficients comprise measures of central tendency like mean, median, mode, and measures of variability like Standard error, Variance, Range, Kurtosis.
We will select "Descriptive statistics" tool in Analysis ToolPak. "Descriptive statistics" dialog asks us to enter what range will be used as a source of data (1). This range, in our example, has two columns and we will get results for each of them. Program doesn't know whether data in selected range is organized in Columns or Rows. We will choose Columns (2) in our case, to solve that dilemma. Our data has labels in the first row, so we have to check option (3) in order to have first row excluded from calculations.
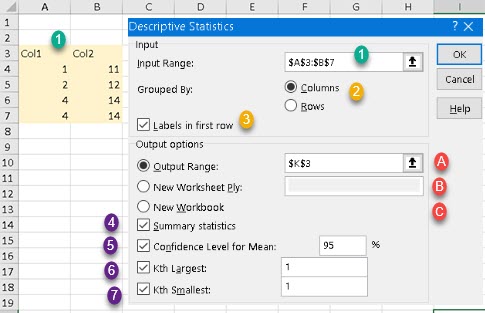
Final output can be directed to a range in the same sheet or some other sheet in the same workbook (A). This range is defined by it's top left cell. Option (B) means that new sheet will be created with provided name and result will be pasted in "A1" cell in that new sheet. Selection of option (C) will create new workbook with the name "Book1", and the result will be pasted in sheet "Sheet1" in cell "A1" in that workbook.
Last options (4,5,6,7) are for selecting what results should be calculated. Option (4) "Summary statistics" should always be selected because without it most of important indicators (mean, variance…) will not be part of a final result. Option (5) needs confidence level for calculating confidence interval for the mean. Without it checked, we will not get this result. Options (6,7) will give us the same results as SMALL and LARGE functions in Excel.
Descriptive Statistics Results
| This is what the results of descriptive statistics would look like. We have results both for Col1 and Col2. For each column there is a list of different indicators which describe our data set. We will only analyze results for the first column. | 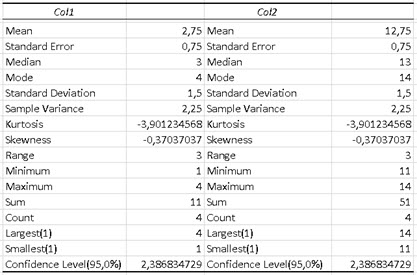 |
| To the right, we can see all the results for first column, with the same results calculated by using Excel formulas. We can see that all the results are the same but there is one potential difference. If there are multiple values in data set that could be considered as Mode ( e.g. 1,1,2,5,5 ), Analysis ToolPak would return the last one ( 5,5 ), but the MODE function would return the first one ( 1,1 ). |  |
Formulas used in Analysis ToolPak descriptive statistics
Bellow are listed formulas used for calculation of some descriptive indicators.
| Standard Deviation | 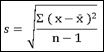 | Variance | |
| Standard Error | Confidence Interval |  | |
| Kurtosis | Skewness |
Let's calculate Confidence Interval by using its formula. Because our sample is smaller than 30 observations, we will use t distribution. For 95% confidence level, with 3 degrees of freedom, t value would be 3.1824. That means that t * sx̄ = 3.1824 * 0,75 = 2.3868. This is the same result as Excel CONFIDENCE.T function is returning. Now our confidence interval is ( 2,75 – 2,3868; 2,75 + 2,3868 ), which is ( 0,3632; 5,1368 ).
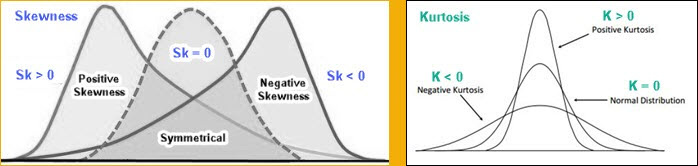
Kurtosis and Skewness are used to describe how much our distribution fits into normal distribution. If Kurtosis and Skewness are zero, or close to zero, then we have normal distribution.
Analysis ToolPak Descriptive Statistics through VBA
Descr Subprocedure
Different functionalities of Analysis ToolPak can be called through VBA subprocedures. Bellow we can see how to provide arguments and call procedure with the name "Descr" for descriptive statistics. All arguments except the first one are optional. All arguments are of a type Variant.
Sub subDescrFunction()
Dim inputRng As Range: Set inputRng = Range("Sheet1!A3:B7")
Dim outputRng As Range: Set outputRng = Range("Sheet1!K3")
Application.Run "Descr", inputRng, outputRng, "C", True, True, 1, 1, 95
End Sub| inprng | This is input range, with our data set. |
| outrng | This is output range. Output range is declared with a reference to a top left cell of the output range. If we type some word here, Analysis Toolpak will export result into new worksheet with such name. If this argument is False, blank or omitted, new workbook will be created. |
| grouped | Is our data set organized in rows or columns? Depending on that, we type "R" or "C". "C" is default. |
| labels | Here we should type "True" if our data set has header. If False or omitted, then we claim that there are no labels. |
| summary | Type "True" to get all major descriptive statistics. If this argument is False, blank or omitted, those values will not be calculated. |
| ds_large | What k-th largest value to get? If this argument is omitted, this value will not be calculated. |
| ds_small | What k-th smallest value to get? If this argument is omitted, this value will not be calculated. |
| confid | What is confidence level for calculating confidence interval for the mean? If this argument is omitted, there will be no result. |
VBA project for Analysis ToolPak (ATPVBAEN.XLAM) is protected with the password "Wildebeest!!". There you can find declarations of all VBA procedures.
DescrQ Subprocedure
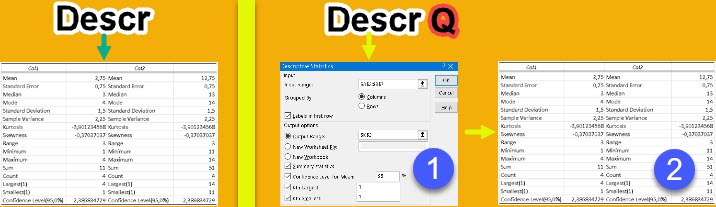
There are two variants of subprocedures for descriptive statistics. First has name Descr, and the second one has name DescrQ. "Descr" would create result immediately by using arguments provided in the code. "DescrQ" would first open GUI dialog filled with values provided in the code (1). We can then accept those values, or we can change them, and then we can click on OK button. Only then, final results will be created (2). "DescrQ" give us opportunity to customize values provided in the code.
All the code for "Descr" and "DescrQ" is the same. Only difference is the name of subprocedure.
Application.Run "DescrQ", inputRng, outputRng, "C", False, True, 1, 1, 95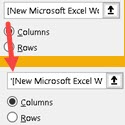 | "DescrQ" version has one bug. Ranges in the dialog will have starting "grave accent" missing. [New Microsoft Excel Worksheet.xlsm]Sheet1'!$D$9:$D$12 'initial formatting '[New Microsoft Excel Worksheet.xlsm]Sheet1'!$D$9:$D$12 'corrected starting sign |
Sample file can be downloaded here: