We saw in one of earlier posts what are descriptive statistics. Let's see how to calculate those statistics in SPSS.
Descriptive Statistics Dialogs
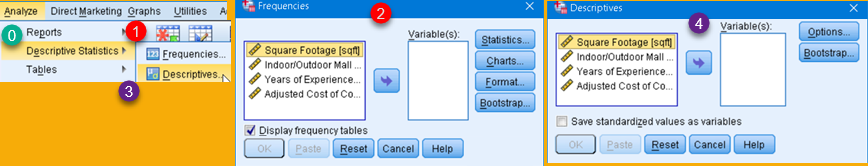
SPSS has two similar dialogs for creation of descriptive statistics. Both dialogs can be called from menu Analyze > Descriptive Statistics (0). There we can choose option Frequencies (1) to get dialog (2), or we can choose Descriptives (3) to get dialog (4). Dialogs (2,4) are similar. Dialog Frequencies gives us more options than dialog Descriptives.
First step is to select columns for which we will calculate descriptive statistics. By using mouse, and keys Ctrl or Shift, we should select some of the columns from the first pane (1). Then we will click on button (2) so that columns are moved to second pane (3). These are the columns for which we will get our descriptive statistics.
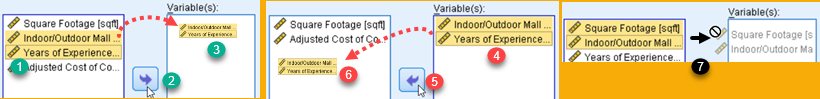
If we had made a mistake, it is possible to move columns from the right pane to the left pane, by using the same process (4,5,6). It is also possible to move selected columns to opposite pane by dragging and dropping with mouse (7).
Analyze > Descriptive Statistics > Frequencies
In Frequencies dialog, we should click on "Statistics" button (0). This will open new dialog where we can choose what descriptive statistics should be calculated. We can choose Percentiles (1), Central Tendency statistics (2), Measures of Variability (3), and Distribution (4).
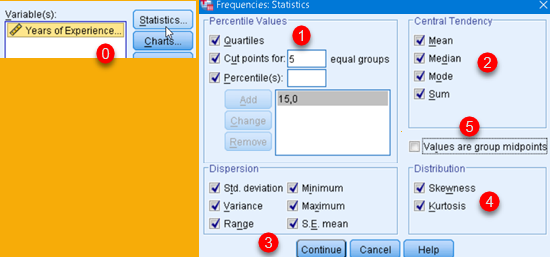
Option (5) "Values are group midpoints" is used when our source data is grouped and each group is presented by one value. For example, all people in their thirties are coded as value 35. In that case this option "Values are group midpoints" will estimate Median and Percentiles for original, ungrouped data.
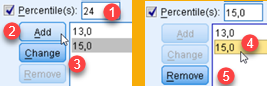
Custom percentiles are added by typing them into textbox (1) and then we click on "Add" (2). This will add that percentile ("24") to the pane bellow. If we click on "Change" (3) then the new value ("24") will replace currently selected old value ("15"). If one of the values (4) is selected then we can remove that value with button "Remove" (5).
Now we can click Continue and OK to close all dialogs and SPSS will calculate our results. All the results will be presented in one tall table (1). On the top we can see valid and missing values (2). Missing values are nulls. Bellow are all the others statistics that we are already familiar with (3).
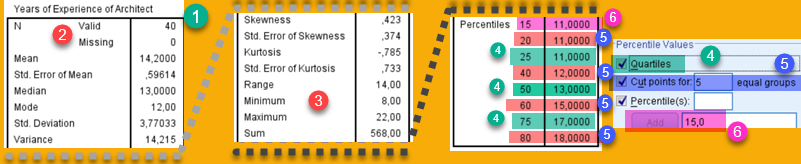
At the bottom of the table, we have percentiles. All the percentiles are presented together (4,5,6). I've color-coded the percentiles here to help us understand the "Percentile Values" options. If we check option "Quartiles" (4), we will get percentiles 25, 50, 75. Option (5) allow us to divide 100% to several groups of equal size in %. If we want to get 5 groups, then 100% will be divided by using 4 cut points. Those cut points are 20, 40, 60 and 80 ![]() . At last, we will see all custom percentiles we have entered (6).
. At last, we will see all custom percentiles we have entered (6).
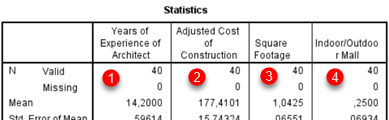 | For several selected variables result would be presented as new columns in the result table. Order of columns will be the same as order of selected variables. |
Analyze > Descriptive Statistics > Descriptives
 | If we use Descriptives dialog, process is similar. First, we select our columns (3) and then we click on button (1). This will open dialog (2) where we can select what descriptive statistics should be calculated. Final result will be presented in one table where each variable will have its results presented in one row. Order of rows can be controlled by options (4). Default is to use "Variable list" as order of columns (5). 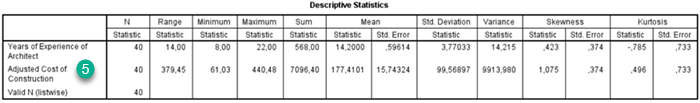 |