This is the standard dialog for changing the pivot table style. Below we will list the elements of this style that can be changed, with the corresponding images.
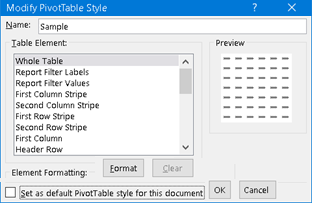
Some of these changes require that the appropriate Pivot Style Options are enabled.

"Whole Table" will affect all parts of the pivot table, including filters.
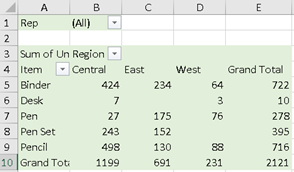
"Report Filter Labels" and "Report Filter Values" will only affect the filter section.
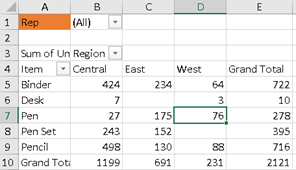
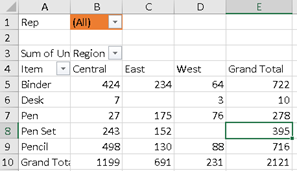
"First and Second Column Stripe", "First and Second Row Stripe", will alternately color columns and rows. If we specify both rows and columns, they will overlap, but the rows will have priority. It is possible for the same color to repeat multiple columns/rows. For example, we can have two green and then two orange columns and so on alternately.
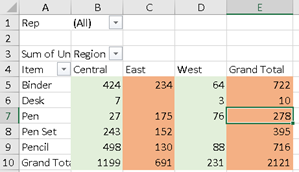
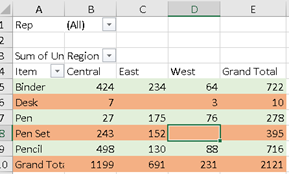
The "First Column" and "Header Row" can also overlap, in the corner cell. Here too, the color given to the row will take precedence.
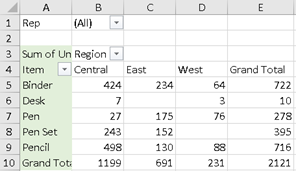
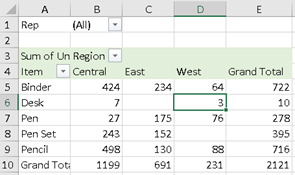
"The First Header Cell" will color the top left cell in the pivot body. The name of the measure used is usually written there.
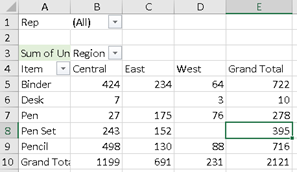
"Subtotal Column" and "Subtotal Row" will color the subtotals by columns and rows. There are "Subtotal Column 1,2,3" and "Subtotal Row 1,2,3", so the first three levels of subtotals can have their own colors.
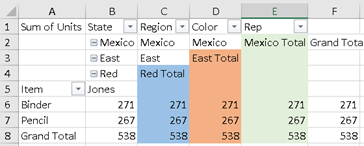
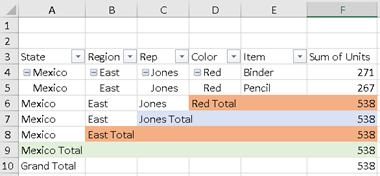
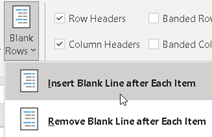
If we turn on the "Blank Row" option then we will have an empty line after each subtotal. The "Blank Row" part of pivot style will color all rows below the first blank row.
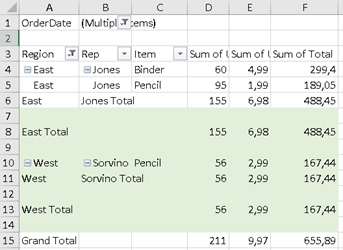
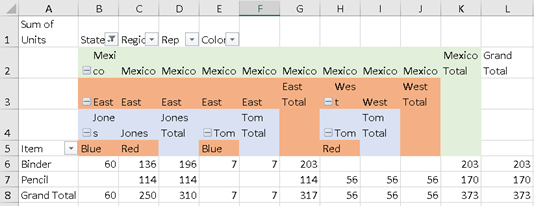
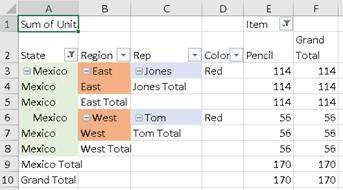
"Column Subheading" and "Row Subheading" will color the row and column headers. There are "Column Subheading 1,2,3" as well as "Row Subheading 1,2,3" so we can have up to three colors for different levels of headers.
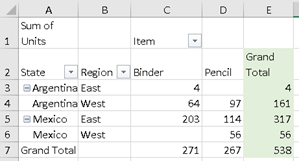
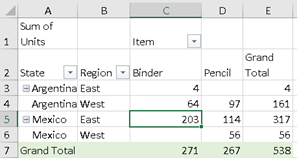
For totals we have the opportunity to design "Grand Total Column" and "Grand Total Row".
Sample Excel file can be downloaded here: