Power Query

XML flattening (expanding) in Power Query

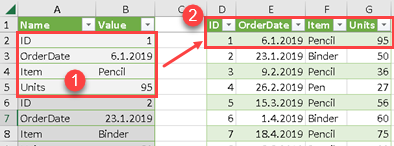
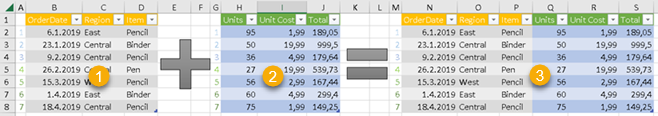
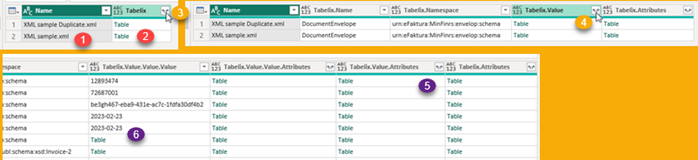
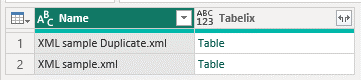
I have two XML files in folder (1). Their content is in the tables in column (2). Their content is extracted with "Xml.Document" function. If I click the Expand button (3) I could expand second column (2). After that I would have to expand the next column (4), and so on. I would end up flattening all my XML files. There are two problems with this approach. The first is that I don't want to click the expand button, I want to automatically expand all the columns (5). Another problem is that some columns may have a combination of tables and values in one column (6). In that case the expand button will not work. Let's solve this two problems.

funcIsOnlyTables

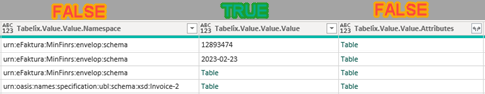
I need several helper functions to achieve my goal. funcIsOnlyTables is function which will tell me whether the only content of some column are nested tables. This function accepts two arguments – a table and a column position. This function will return TRUE if all the cells in that column have nested tables. Here, we are using function "Table.MatchesAnyRows" to see is there any cell in our column that has content that is not of type table.  If that is FALSE, then our function should return TRUE, because that mean that we only have nested tables in our column.

( TableToExpand as table, ColumnNumber as number) =>
let
    ColumnName = Table.ColumnNames( TableToExpand ){ColumnNumber}    
    , TemporaryRenaming = Table.RenameColumns( TableToExpand, { { ColumnName, "ŽŽŽ" } } )
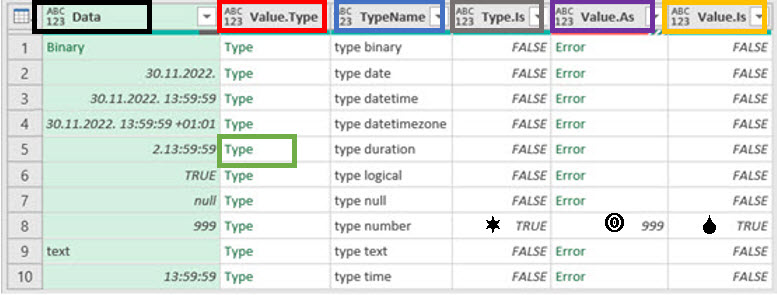
    , HasSomethingElse = Table.MatchesAnyRows( TemporaryRenaming, each not Value.Is( [ŽŽŽ], type table ) )
    , HasOnlyTables = not HasSomethingElse
in
    HasOnlyTables

I had to rename my column because I had to reference it somehow in "Value.Is" function.

funcIsOnlyNonTables

funcIsOnlyNonTables is similar function. It works in the same way. The only difference is that we are here looking for cells that are of type table. If there are such cells, then our function will return FALSE, because that means that our column has some cells with nested tables.

( TableToExpand as table, ColumnNumber as number) =>
let
    ColumnName = Table.ColumnNames( TableToExpand ){ColumnNumber}    
    , PrivremenoPreimenovanje = Table.RenameColumns( TableToExpand, { { ColumnName, "ŽŽŽ" } } )
    , HasTables = Table.MatchesAnyRows( PrivremenoPreimenovanje, each Value.is( [ŽŽŽ], type table ) )    
    , IsOnlyNonTables = not HasTables
in
    IsOnlyNonTables

Residual logic

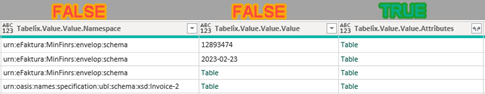
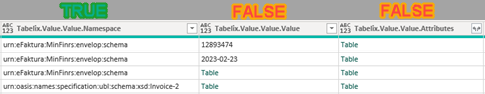
If both functions, "funcIsOnlyTables" and "funcIsOnlyNonTables" return FALSE then our column is of mixed type. It has both nested tables and values.

Now, we can discover nature of each column, so we can process each column differently based on its content.

funcExpandColumn

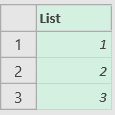
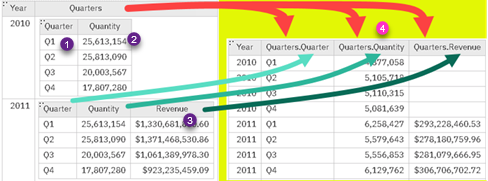
"funcExpandColumn" will expand only those columns that only have nested tables. First we have to create a list of all the names of columns in nested tables. On image, such list would be { "Quarter", "Quantity", "Revenue" } (1,2,3). We would prefix each subcolumn name with the name of original column ( "Quarters" + "." +  "Quantity" (4) ), so that each newly created column has unique name. Then, it is easy to expand our column with Table.ExpandTableColumn function.

( TableToExpand as table, ColumnNumber as number) =>
let
    ColumnName = Table.ColumnNames( TableToExpand ){ColumnNumber}    
    , TakeNamesOfSubColumns = List.Union( List.Transform( Table.Column( TableToExpand, ColumnName )
         , each Table.ColumnNames( _ ) ) ) 
    , NewNames = List.Transform( TakeNamesOfSubColumns, each ColumnName & "." & _ )
    , Expanding = Table.ExpandTableColumn( TableToExpand, ColumnName, TakeNamesOfSubColumns, NewNames )
in
    Expanding

funcTabelizeExpand

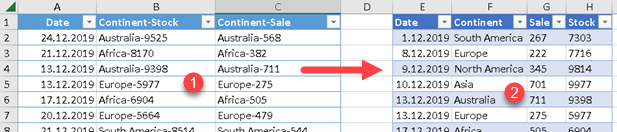
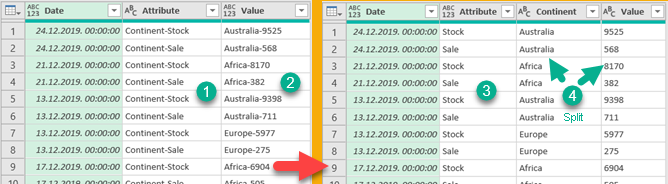
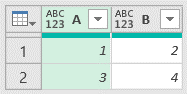
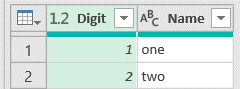
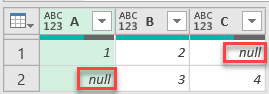
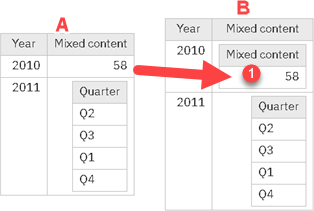
This function will solve the problem of columns with mixed content. We will transform each mixed column (A) into column where all the cells are tables (B). We will achieve that by wrapping each non table value with table that has one column and one row (1). Name of that new column (1) will be the same as the name of major column (B). Now that all the cells are filled with nested tables, we will just call function "funcExpandColumn" that we saw in the earlier step.

( TableToExpand as table, ColumnNumber as number) =>
let
    ColumnName = Table.ColumnNames( TableToExpand ){ColumnNumber}    
    , Tabelize = Table.TransformColumns( TableToExpand, { {   ColumnName, each if Value.Is( _, type table ) then _ 
          else #table( { ColumnName }, { { _ } } )    } } )
    , Expanding = funcExpandColumn( Tabelize, ColumnNumber )
in
    Expanding

Final logic

Now we have all the ingredients to flat our XML file. First we will prepare our input. Input is a table which have names of XML files, from some folder, in its first column "Name". Second column "Tabelix" has content of those files that is fetched with "Xml.Document" function.

"funcExpandAll" is the last function. This function will use all of the previous functions. This function is based on all powerfull "List.Generate" function. We will not use recursion, because "List.Generate" is faster. Logic of "List.Generate" function is similar to recursion. We have three steps:
1) First step is to establish initial conditions. TableToExpand is the table from the image above. ColumnNumber is a column of that table that will be first process, so it will be number zero.

2) Second step is condition. We will end processing of columns when we reach the last column. Note that number of columns in our table will increase with each "Table.ExpandTableColumn". This means that we don't have only two columns from the table from the image above ("Name" and "Tabelix"). As we expand columns, number of columns will increase (like on the first image in this blog post).

3) Third step is processing.  In first cycle, processing is done on initial arguments TableToExpand and ColumnNumber. After first cycle, new values will be created and those new values will be input arguments for the nest cycle. Just like in recursion.
a) Here we use IF logic to decide how to process current column. If we have normal column, we want change anything. If we have column with nested tables, we will apply expansion with "funcExpandColumn". In all other cases we have mixed column. For mixed columns we will call function "funcTabelizeExpand" which will first make sure that all the values are tables and then it will call "funcExpandColumn" to finish the job. Result of the first cycle will be initial table unchanged, or it will be initial table with one column expanded.
b) We also have to change the column that will be processed in the next cycle. If we didn't work on column that had only "non table" values, then that column is just expanded and newly created column on that position could also contain nested tables. We will have to cycle through column on that position again. If our column had only normal values (numbers, strings, dates) then we can jump to the next column.

( TableToExpand as table ) =>
let
    ExpandAll = List.Generate( 
        ()=>[ TemporaryResult = TableToExpand, ColumnNumber = 0 ]
        , each [ColumnNumber] < Table.ColumnCount( [TemporaryResult] )
        , each [ TemporaryResult = if funcIsOnlyNonTables( [TemporaryResult], [ColumnNumber] ) then [TemporaryResult] 
             else if funcIsOnlyTables( [TemporaryResult], [ColumnNumber] ) 
                 then funcExpandColumn( [TemporaryResult], [ColumnNumber] )
             else funcTabelizeExpand( [TemporaryResult], [ColumnNumber] )
        , ColumnNumber = Iif not funcIsOnlyNonTables( [TemporaryResult], [ColumnNumber] ) then [ColumnNumber] 
             else [ColumnNumber]  + 1  ]               
        , each [TemporaryResult]
    )
    , OnlyLastElement = List.LastN( ExpandAll, 1 ){0}
in
    OnlyLastElement

"List.Generate" will return all the interim results as a list. That is why, we want to fetch only the last one.

Sample file can be downloaded from here. Just go to "XMLsInput" query to change the folder where XML files are placed on your hard disk.

Three interesting cases in Power Query

Code for all three examples can be found in sample file that can be downloaded below.

Uncomplete Pivot

After cleaning some data from XML file, I got all the values presented vertically (1). My goal was to transform this table (1) into normal horizontal table (2). This can be done with Table.Pivot function.

Problem is that, above, in the left table we only have 2 columns. That is enough to write down our Table.Pivot function, but our result will not be correct. We will get an error.

Table.Pivot( FillDownID, { "ID", "OrderDate", "Item", "Units" }, "Name", "Value" )

The problem stems from the fact that there are no other columns to make up the rows of our pivot tables. So, we have to generate one more column. That column should uniquely define each row of a new table. We have to use ID values to create our new column.

First, we will use IF expression to create new column (1). After this, we can fill down values in that column, to fill empty spaces (2).

That is all. Now, we can use our Table.Pivot function to create final result, because our source table now has three needed columns.

Concatenated Values

I got an Excel file with values concatenated, as in (1). As always, we want our data presented as a regular table (2).

First we need to untangle concatented values that are tied to the names of contintents. Because we have two columns with such data (Stock and Sale), our first step is to unpivot table (1). Only then can we fix concatenated values.

We will then remove prefix "Continent-" from "Attribute" column (1->3). After that, we will split column "Value" into to two columns (2->4) by using function Table.SplitColumn. Next, we can have our final result by applying Table.Pivot function on the table with corrected columns.

Table.Pivot( SplitValueColumn, { "Sale", "Stock" }, "Attribute", "Value" )

Direct Join

We have two tables (1,2). We want to join them into one table (3). First row should be joined with the first row, second row with the second row, etc. Problem is that the first table contains only dimensions, and second table contains only values, there is no column to base our join on. We can not use Table.Join function.

Solution is to flip our columns and rows with Table.Transpose. We'll get transposed tables (1). Each table will have exactly 7 columns because the original tables had 7 rows. Now we can create their union (2) to get table (3). Table (3) has two problems. First problem is that columns and rows are switched, second problem is that we have lost column names. By transposing table (3) we can solve first problem.

Second problem should be solved by taking original column names from tables (1,2). Then, those column names must  be applied to the final table (4).

Sample file can be downloaded from here:

Literals in Power Query (M language)

Table

We can create empty table by specifying number of columns to create. For values we just have to provide empty list.
#table(4,{})
This is how we create regular table. All the columns will have unspecified type.
#table( {"A", "B"}, { {1, 2}, {3, 4} } )
We can assign type to table columns.
#table(type table [Digit = number, Name = text], {{1,"one"}, {2,"two"}, {3,"three"}} )

Some information about Tables

It is possible to make an union of several tables with "&" operator. Orphan columns will be filled with nulls.
#table({"A","B"}, {{1,2}}) & #table({"B","C"}, {{3,4}})

Tables are considered the same if for each column in one table there is equivalent column in another table. Order of columns is not important.

#table({"A","B"},{{1,2}}) = #table({"A","B"},{{1,2}}) // true
#table({"A","B"},{{1,2}}) = #table({"X","Y"},{{1,2}}) // false
#table({"A","B"},{{1,2}}) = #table({"B","A"},{{2,1}}) // true

Number

There are three ways to write literal numbers.
Regular = -1.5
Scientific = 2.3e-5
Hexadecimal = 0xff
There are also two special symbols for infinity and for "not a number". Infinity is something we get when we try to divide one and zero. If we try to divide zero and zero, we will get "NaN". "NaN" is the only value that is not equal to itself.
Infinity = #infinity
NaN = #nan

Type

With "type" keyword we can create literal types.
ListOfNumbers = type { number }
TwoNumberFieldsRecordType = type [ X = number, Y = number ]
DateTimeType = type datetime
TextType = type text

Logic, text and null

Logic literals are TRUE and FALSE. Text literals are wraped with quotes. Null is a special literal which symbolizes missing data.
TRUESymbol = true
FALSESymbol = false
TextLiteral = "word"
NullSymbol = null

Record

This is how we can write record literal.
Record = [ A = 1, B = 2 ]

Some information about records

Records are equal if for each field in one record ther is an equal field in another record. Order of fields is not important.

[ A = 1, B = 2 ] = [ A = 1, B = 2 ]        // true 
[ B = 2, A = 1 ] = [ A = 1, B = 2 ]        // true

We can make a union of several records. If we have one field in more than one record, then the value from the last record with that field will be the final one. In our example x will be assigned the value 3, and not the value 1.

[ x = 1, y = 2 ] & [ x = 3, z = 4 ]  // [ x = 3, y = 2, z = 4 ] 

List

List is created by placing comma separated list inside of curly brackets.
List = {1, 2, 3}

Some information about lists

Two lists are equal if the have the same elements and position of those elements is the same.

{1, 2} = {1, 2} // true 
{2, 1} = {1, 2} // false

We can concatenate several lists with & operators.

{1, 4} & {2, 3} // list concatenation: {1, 4, 2, 3} 

Special Signs

Special signs, that are invisible, can be written by their symbolic presentation.
TAB = #(cr)
LineFeed =  #(lf)
CariageReturn = #(tab)

I used some unusual unicode brackets in the "Expression" column to prevent typed text to be identify as a special sign. In the "Result" column, we can see that both "cr" and "lf" signs are causing line break.

If we want to type two characters "#(", we have to write them like "#(#)(", because those characters has to be escaped. Two signs "#(cr)#(lf)", when consecutive, can be typed as "#(cr,lf)", the result would be the same.

Unicode Signs

We can enter any Unicode symbol in Power Query by using their codes.
YenSymbol = "#(00A5)"
CopyRightSymbol = "#(00A9)"
CapitalTheta =  "#(0398)"

Binary – list of bytes

Binary data is actually list of bytes. We can present those bytes with letters, hexadecimal numbers or ordinary numbers.
BinaryByLetters = #binary("AQID")
BinaryByHexidecimalNumbers = #binary( {0x00, 0x01, 0x02, 0x03} )
BinaryByRegularNumbers = #binary({65, 66, 67})

Date and time

Date and time can be expressed with these literals.

#time(hour, minute, second)
#date(year, month, day)
#datetime(year, month, day, hour, minute, second) 
#datetimezone( year, month, day, hour, minute, second, offset-hours, offset-minutes) 
#duration(days as number, hours as number, minutes as number, seconds as number)
For each argument there is a limit on what values that argument could have.
1 ≤ year ≤ 9999
1 ≤ month ≤ 12
1 ≤ day ≤ 31
0 ≤ hour ≤ 23
0 ≤ minute ≤ 59
0 ≤ second ≤ 59
-14 ≤ offset-hours ≤ 14
-59 ≤ offset-minutes ≤ 59

Some information about dates and times

We can concatenate date and time.#date(2013,02,26) & #time(09,17,00) // #datetime(2013,02,26,09,17,00)
We can add duration to date or to time.#datetime(2010,05,20,0,0,0) + #duration( 8, 0, 0 ) //#datetime(2010,5,20,8,0,0)
#time(8,0,0)+#duration(30,5,0,0)     //#time(13,0,0)
Duration can be multiplied.#duration(2,1,0,15.1) * 2      // #duration(4, 2, 0, 30.2)
Durations can be divided.#duration(2,0,0,0) / #duration(0,2,0,0)        //24
Dates and times can be converted to numbers and from.Number.From(#datetime(2020, 3, 20, 6, 0, 0)) // 43910.25
Date.From(43910) // #date(2020,3,20)
Time.From(0.7575) // #time(18,10,48)
Duration.From(2.525) // #duration(2,12,36,0)

Sample file can be downloaded from here:

Basic Type Functions in Power Query

In "Data Types in Power Query" post we saw what types exist in Power Query. Let's see now what functions Power Query has that can deal with types. Most of such functions are classified in "Type" group, but the important ones are placed in "Value" group.

Basic Functions

In the example bellow, the first column has data of different types. All other columns are created by using some Power Query functions, except the column "TypeName" which is created by using our custom function. Name of each column is the same as the name of a function used.

Value.Type(value as any) as type     

Value.Type function receives the values from the first column and then returns its type. In Power Query types are presented only by green word "Type", and those results in second column don't help us much. In order to reveal what type each value really is, we will use our custom function "TypeName". You can find that function in sample file bellow or you can see it in this post. This function will take types from the second column and for each "Type", it will reveal its correct type in the third column. Now we can see all the different types (type null, type text, type date…). 

Value.Type( [Data] ) 
 
TypeName( [Value.Type] )
 
Type.Is( [Value.Type],type number )
 
Value.As( [Data], type number )

Value.Is( [Data], type number )

Type.Is(type1 as type, type2 as type) as logical

Type.Is function will compare two types and will return TRUE or FALSE. In our example we compared types from the column Value.Type with type number. Obviously, only cell in eighth row will return TRUE, because 999 is a number ✶.

Value.As(value as any, type as type) as any

Value.As function is returning value from the first argument, but only if type of that value is compatible with the type that is second argument. If they are not compatible, this function will return error. Because we used type number as second argument, only the cell in eighth row will return 999 , all other cells will return Error.

Value.Is(value as any, type as type) as logical

Value.Is function is comparing type of some value with the type that is the second argument. It will return TRUE or FALSE. In our example, we compare types for values in the first column with type number. This is the reason that only cell in eighth row will return TRUE .

Is and As Operators

If we don't want to hard code our data types, then we have to use Value.As and Value.Is functions. If hard coding our types is OK, then we can use is and as operators. Expressions on the right side will create the same two last columns as in example above.

Not Hard CodedHard Coded
Value.As( [Data], type number )[Data] as number
Value.Is( [Data], type number )[Data] is number

Power Query and protected sheet in Excel

We made a report. We'll give that report to some colleague. He will refresh that report periodically and he will then send it to end users. In the image bellow we can see that our colleague has to prepare 4 Access files as data source, and to open our report (1). He will than refresh it (2). At the end of refreshing MsgBox (3) will appear. After this, our colleague can save the file and he can then send it to other colleagues (4). Idea is to make this process as much easier as possible for our colleague.

One more requirement is that spreadsheet with tables has to be protected so that users can not accidentally change or delete some numbers. When we try to make report, as described, we will find few problems to do so:
1) Tables on protected sheet will not be able to refresh.
2) Combining Power Query and VBA asks for queries to be synchronous, which will prolong queries execution.
3) If we can not use VBA, how to create MsgBox (3)?
Let's see how to solve this problems.

Tables on Protected Sheet Will Not Refresh

When we try to "Refresh All" tables that are located in protected sheet, this is the message we will get. We will have to remove our protection before refreshing our data, and then to protect the sheet again after. Idea is to avoid such step and to automate things.

We could try to solve this problem by using VBA. Usually we would lift the protection, do the changes, and then set protection back. We can use VBA code similar to this bellow:

Sub RefreshTables()
ThisWorkbook.Worksheets("Queries").Unprotect Password:="fff"
ThisWorkbook.RefreshAll
ThisWorkbook.Worksheets("Queries").Protect Password:="fff"
MsgBox "All Tables Refreshed"
End Sub

Problem is that Power Query queries are executed asynchronously. Queries will still be executing (2), VBA will not wait for them to finish, but will show final MsgBox immediately (1). This means that protection on the sheet is already placed. After we click on OK button (1), we will again receive message (3) because of that.

As explained in this post, all we need to do is to make queries synchronous. This is done by unchecking option "Enable background refresh" in query properties.
Unfortunately this would make Refreshing lasting much longer. Instead of executing all of the queries at the same time (1), queries would be executed sequentially, one by one (2). This makes refreshing lasting two times longer, on my computer.
We can try to protect our cells by making some data validation rule that will never be fulfilled. This would prevent users from overwriting numbers in our cells, but it will not stop them from deleting values in our cells. Data validation is only triggered when cell is in Edit mode and the user is trying to enter some data into cell. Edit mode is not needed for deleting cell content, we just select the cell and press Delete key.

Solution for protected sheet

Best solution is to place refreshable tables in one sheet that is unprotected and hidden (2). Numbers from that sheet can be mirrored (3), by using formulas, in another sheet which is protected (4). Cells in protected sheet always have the same, unchanged formulas (5), so they will never trigger sheet protection.

User can now click on Refresh All button in Data tab (1). Tables in unprotected sheets would refresh, and tables in protected sheet would just reflect those results.

MsgBox without VBA

We said that synchronised queries would take longer to execute, so we will avoid VBA. Question is how to create MsgBox at the end of refreshing that would inform user that refreshing is over. The only way to create message in Power Query is by using "error" statement. We have to make sure that "error" statement happens at the end of refreshing when all individual queries are finished.

We can create a query like the one bellow. This query is referencing all other queries. This means that the query bellow has to be executed the last. At the end of refreshing, this query will show user the message that is written in Error.Record. This query has to be loaded into spreadsheet in order to work correctly.

let   
  Result = if { FactSales1, FactSales2, FactSales3, FactSales4 } = { "A","A","A","A" } 
    then "A" else error Error.Record( "Finished", "Refreshing is over." )
in
    Result

We can see bellow that the final query is dependent on all other queries (1). This MsgBox query will never load any data into spreadsheet, so its footprint will be like (2). This query will show us a message that looks like (3) after all other queries are refreshed.

Sample files can be downloaded from here. File "ContosoSales1.accdb" should be copied three more times to create files "ContosoSales2.accdb", "ContosoSales3.accdb", "ContosoSales4.accdb". In "Parameters" Excel sheet, change fullpaths toward those MS Access files.